Context & Problem
Sears Holdings had a vast member base, but internal teams lacked a fast, consistent way to query member data. Analysts, marketers, and product managers relied on fragmented tools, ad-hoc database queries, and manual report requests routed through data engineering. Turnaround times were slow, data access was inconsistent, and teams frequently worked from conflicting numbers.
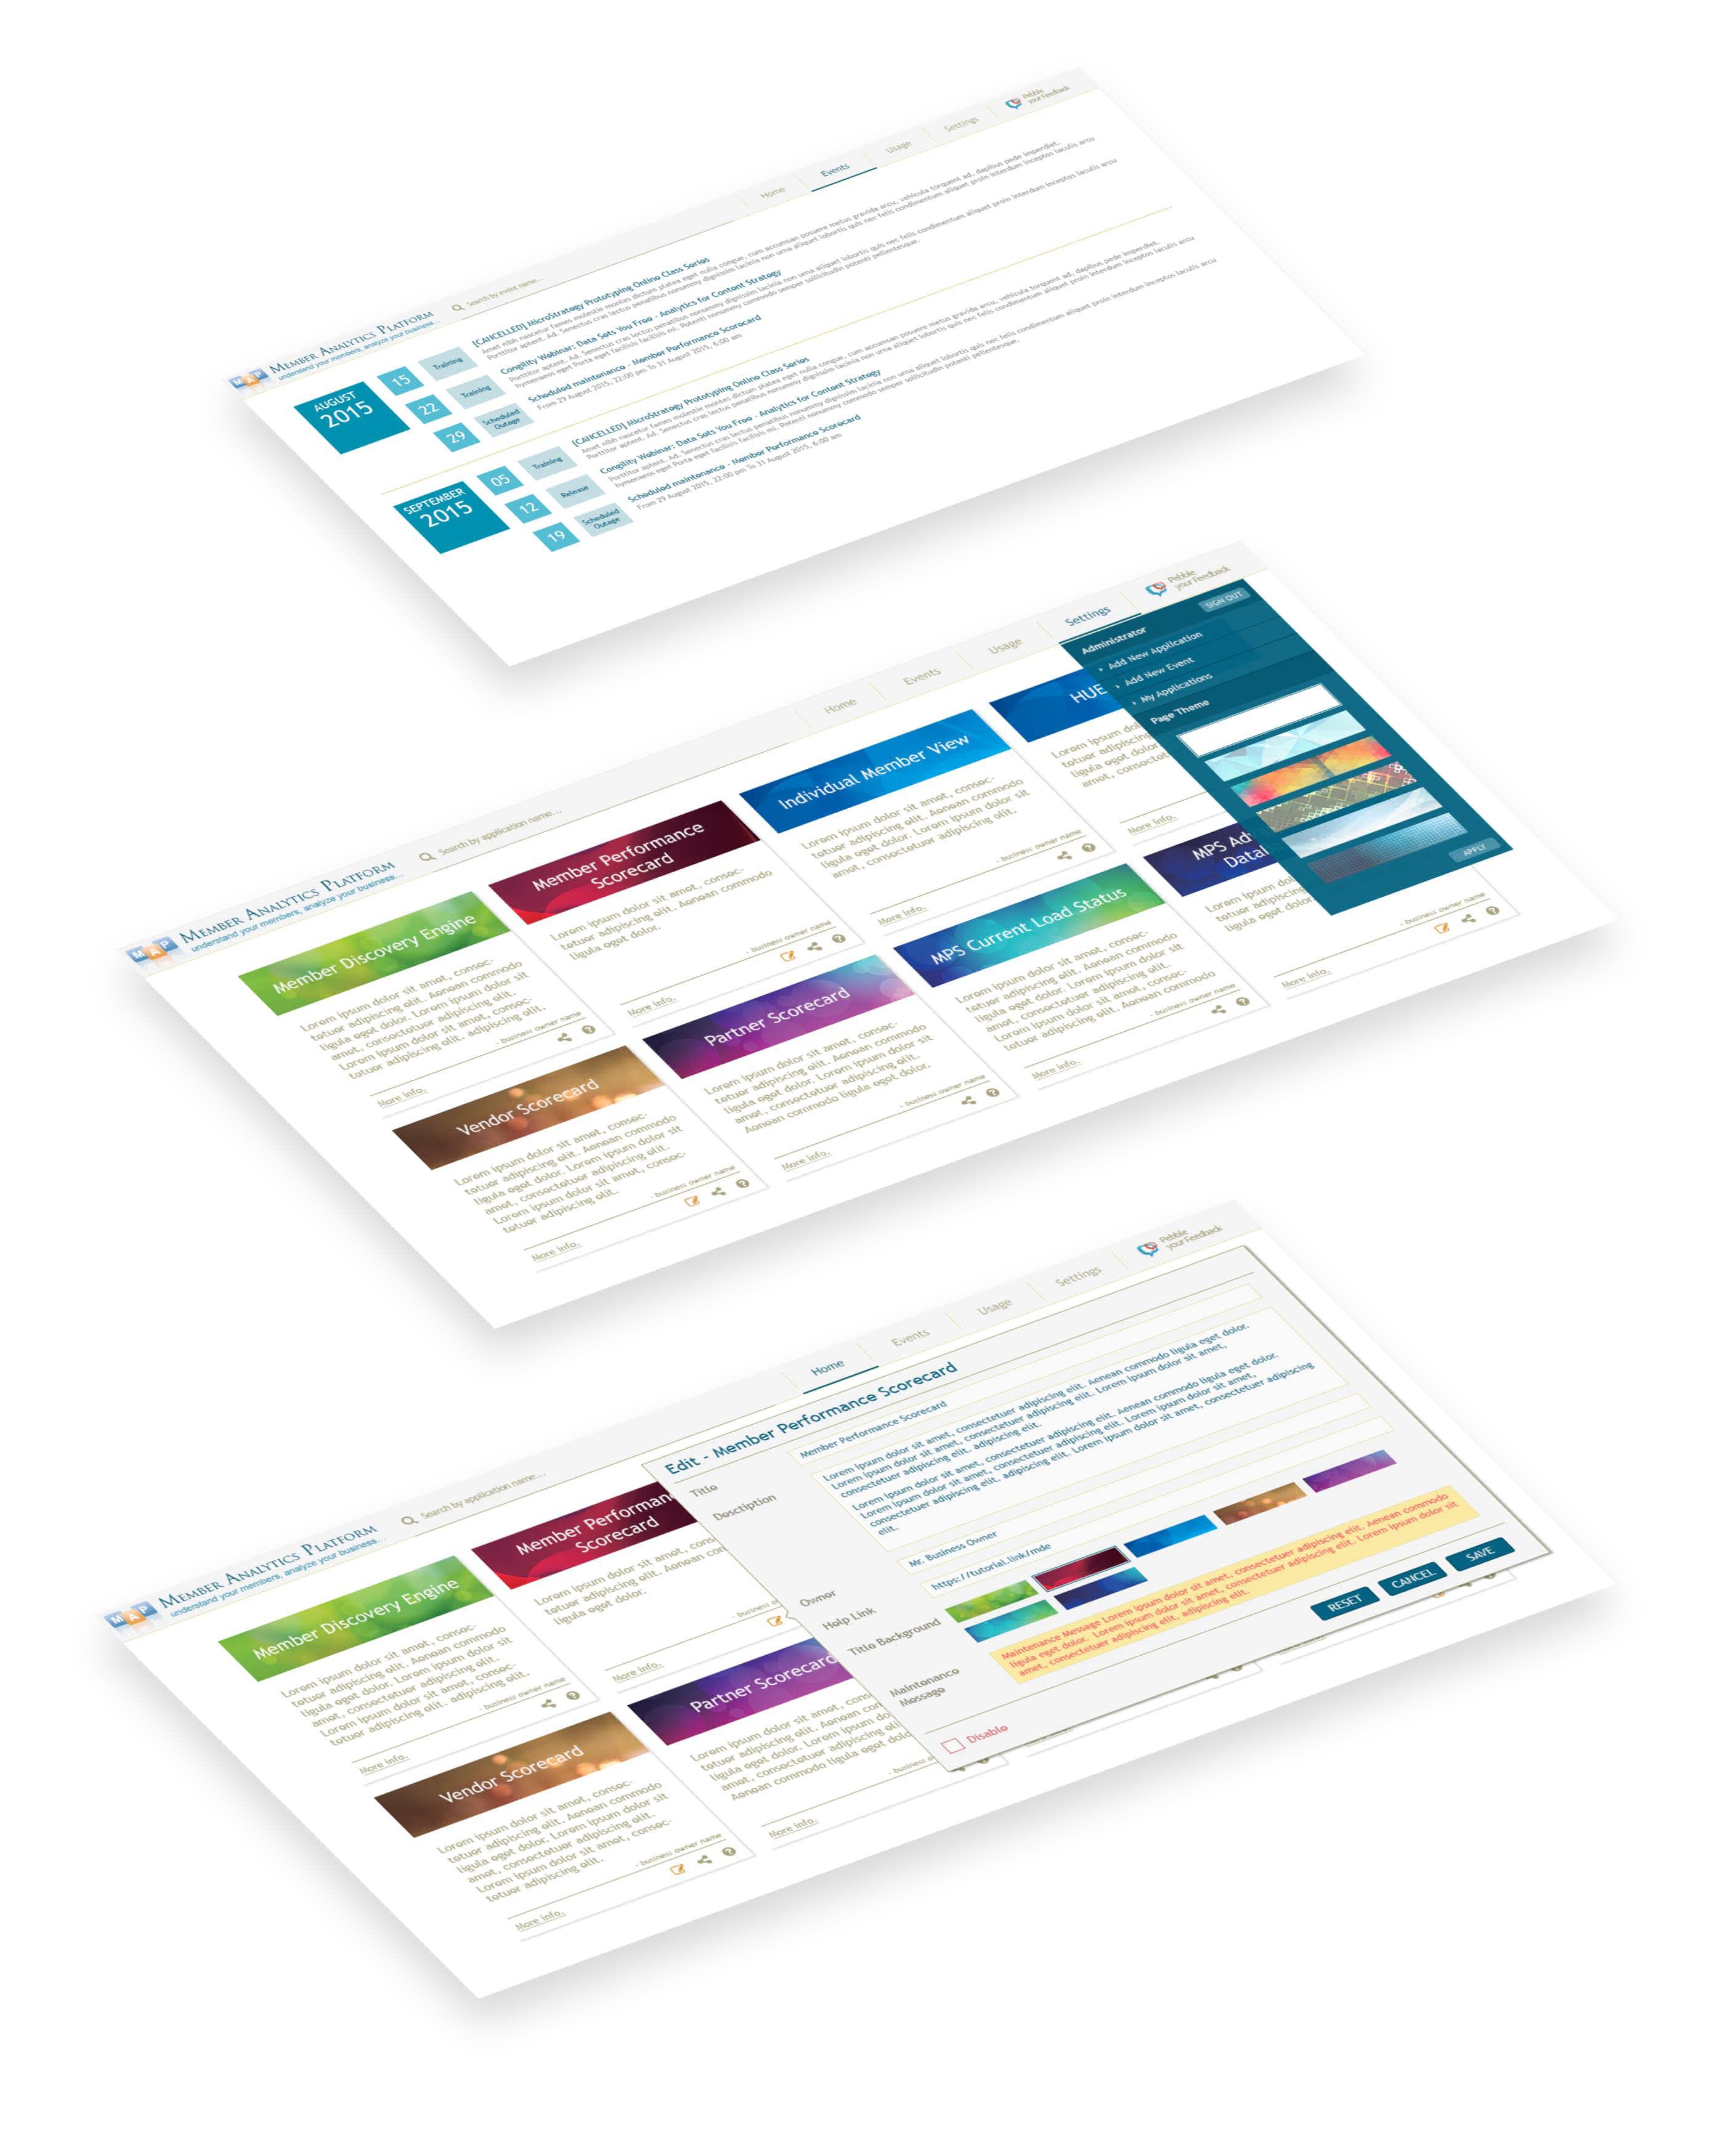
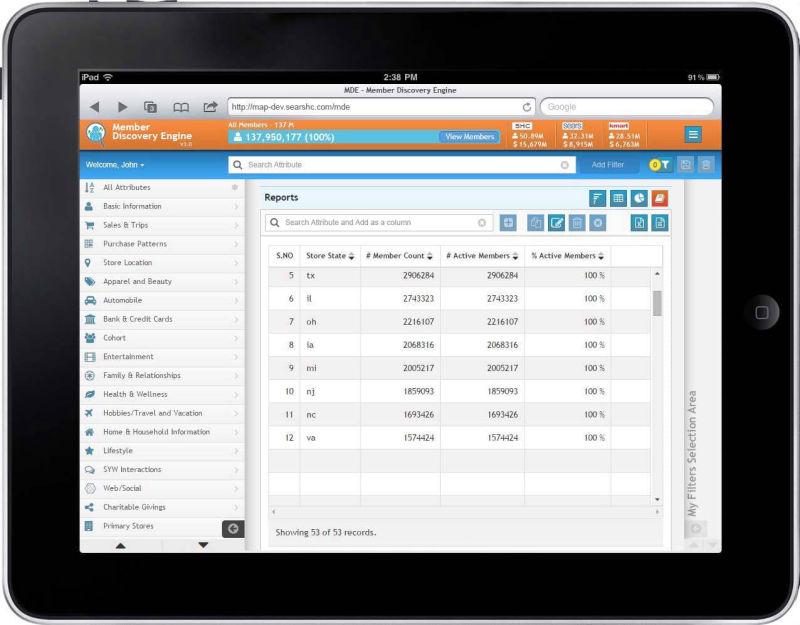
The Member Discovery Engine was conceived as a centralized, self-service analytics platform, a single entry point where internal users could search member profiles, access pre-built reports, and generate insights without waiting on engineering queues. A child application, the Member Analytics Platform, extended this capability with deeper analytical views and data visualizations.
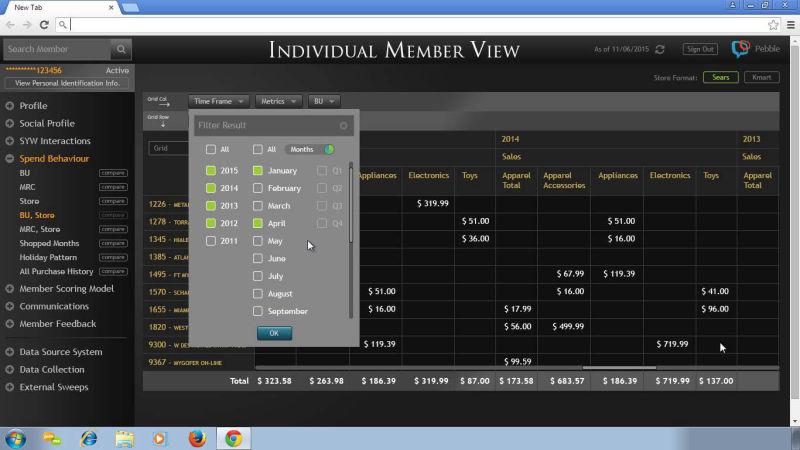
Beyond search and reporting, the platform also needed a way for analysts to drill into individual members. This led to the Individual Member View (IMV), a child application within the MDE ecosystem that provided a deep-dive member profile experience. IMV let analysts explore a single member's purchase history, engagement patterns, segment membership, and loyalty status in one consolidated view. Designing MDE as a parent-child application architecture, where the core search and query platform could spawn focused, context-rich detail views like IMV, was a deliberate platform decision that allowed the system to scale in capability without overwhelming the primary interface.
My Role & Scope
I served as the UI/UX Designer responsible for the full application design, from early sketches through low-fidelity wireframes, high-fidelity responsive prototypes, infographics, and data visualizations. I worked closely with product management, data engineering, and business stakeholders to translate complex data requirements into intuitive, actionable interfaces.
Process & Key Decisions
1. Sketches: exploring the information architecture
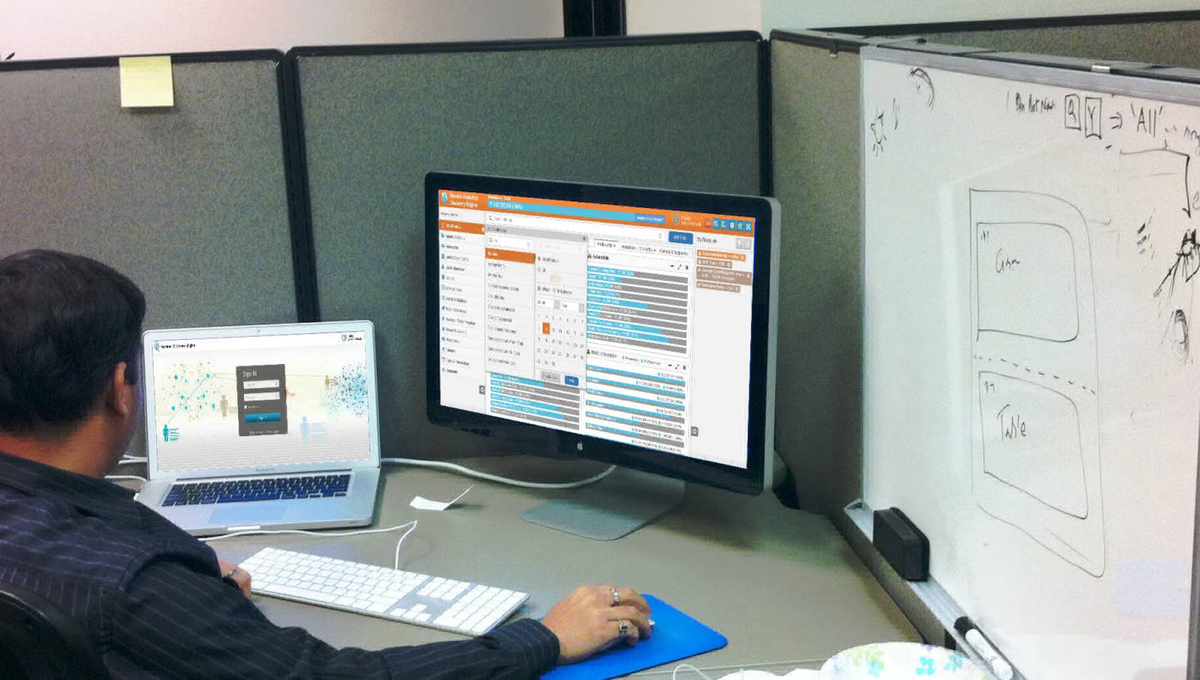
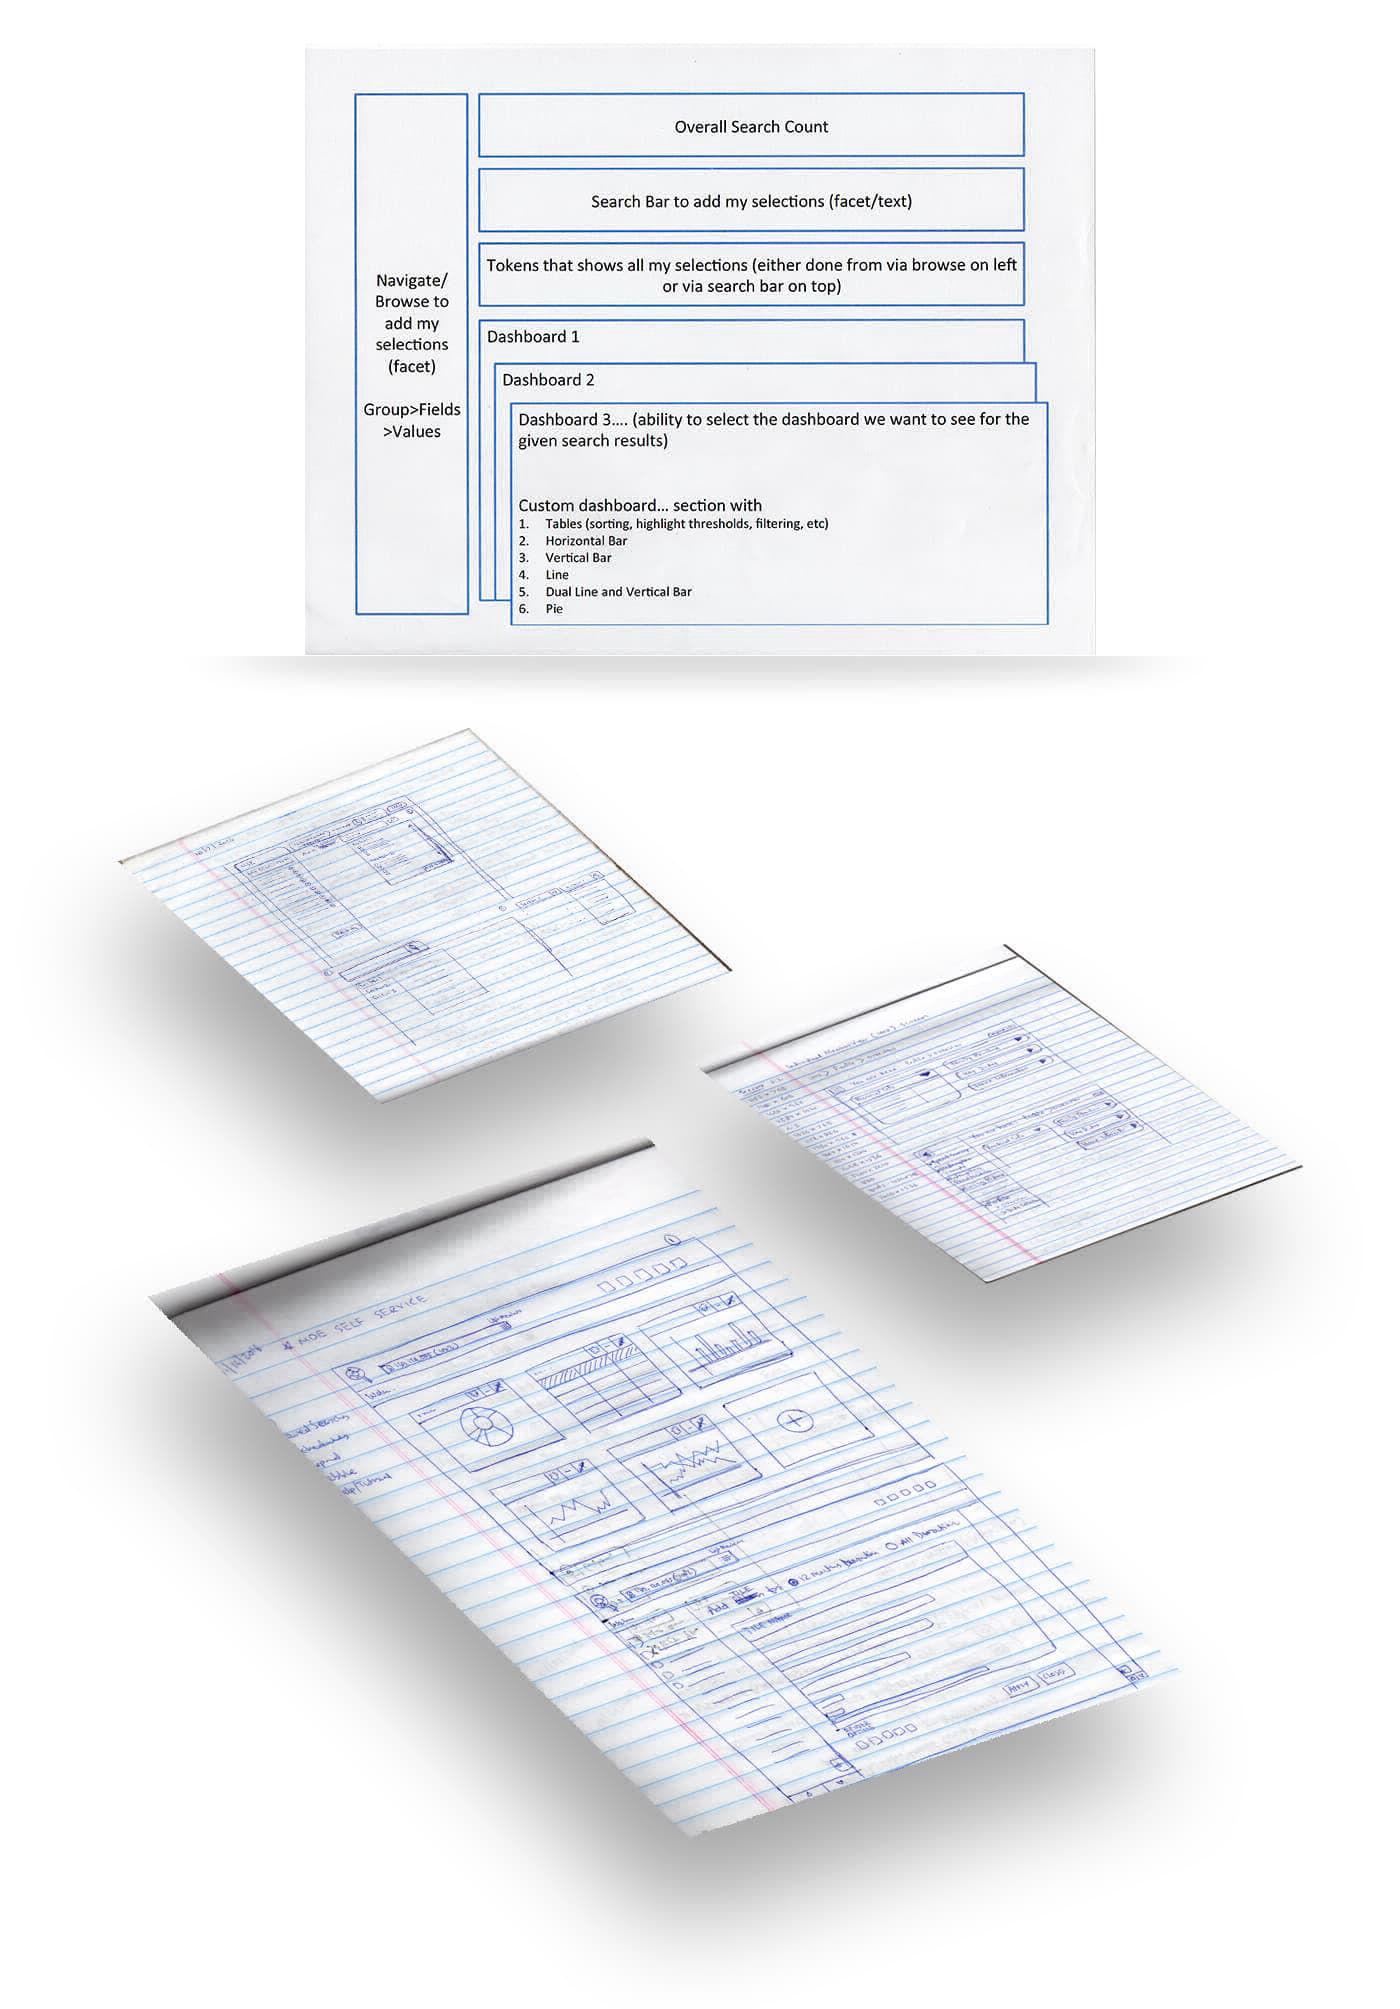
I started with rapid sketching sessions to map out how internal users thought about member data: what they searched for, how they filtered, and what patterns they needed to surface. These sessions helped establish the core navigation model and prioritize the most frequent query paths before committing to any digital layouts.
2. Lo-fi wireframes v1: validating structure
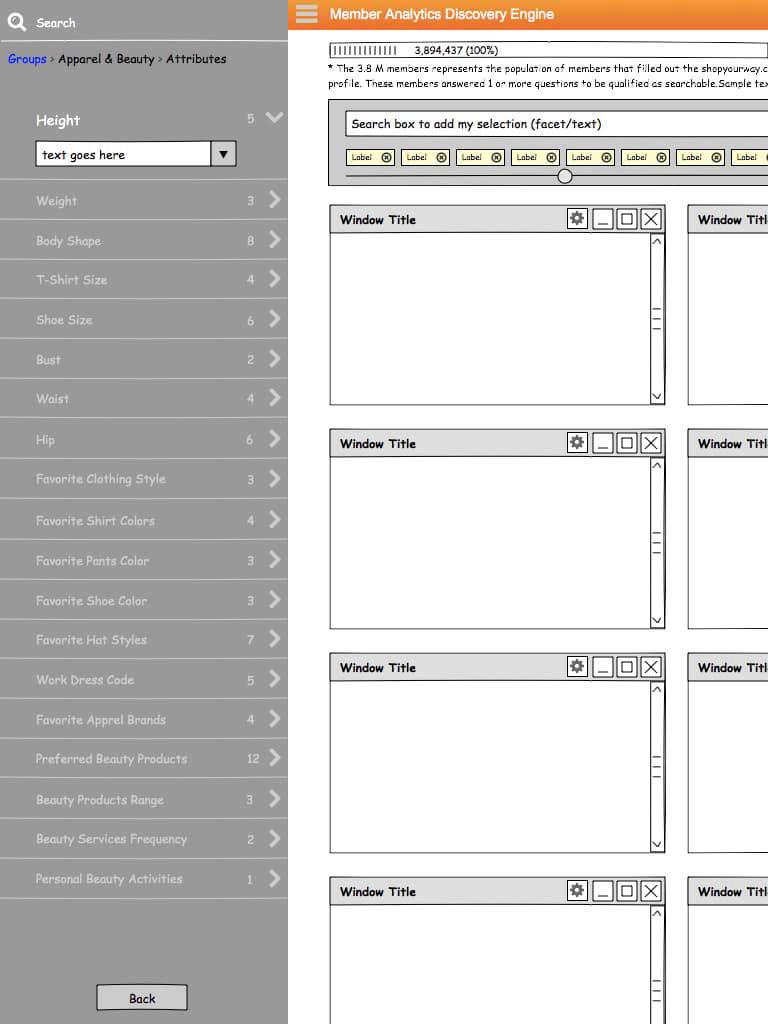
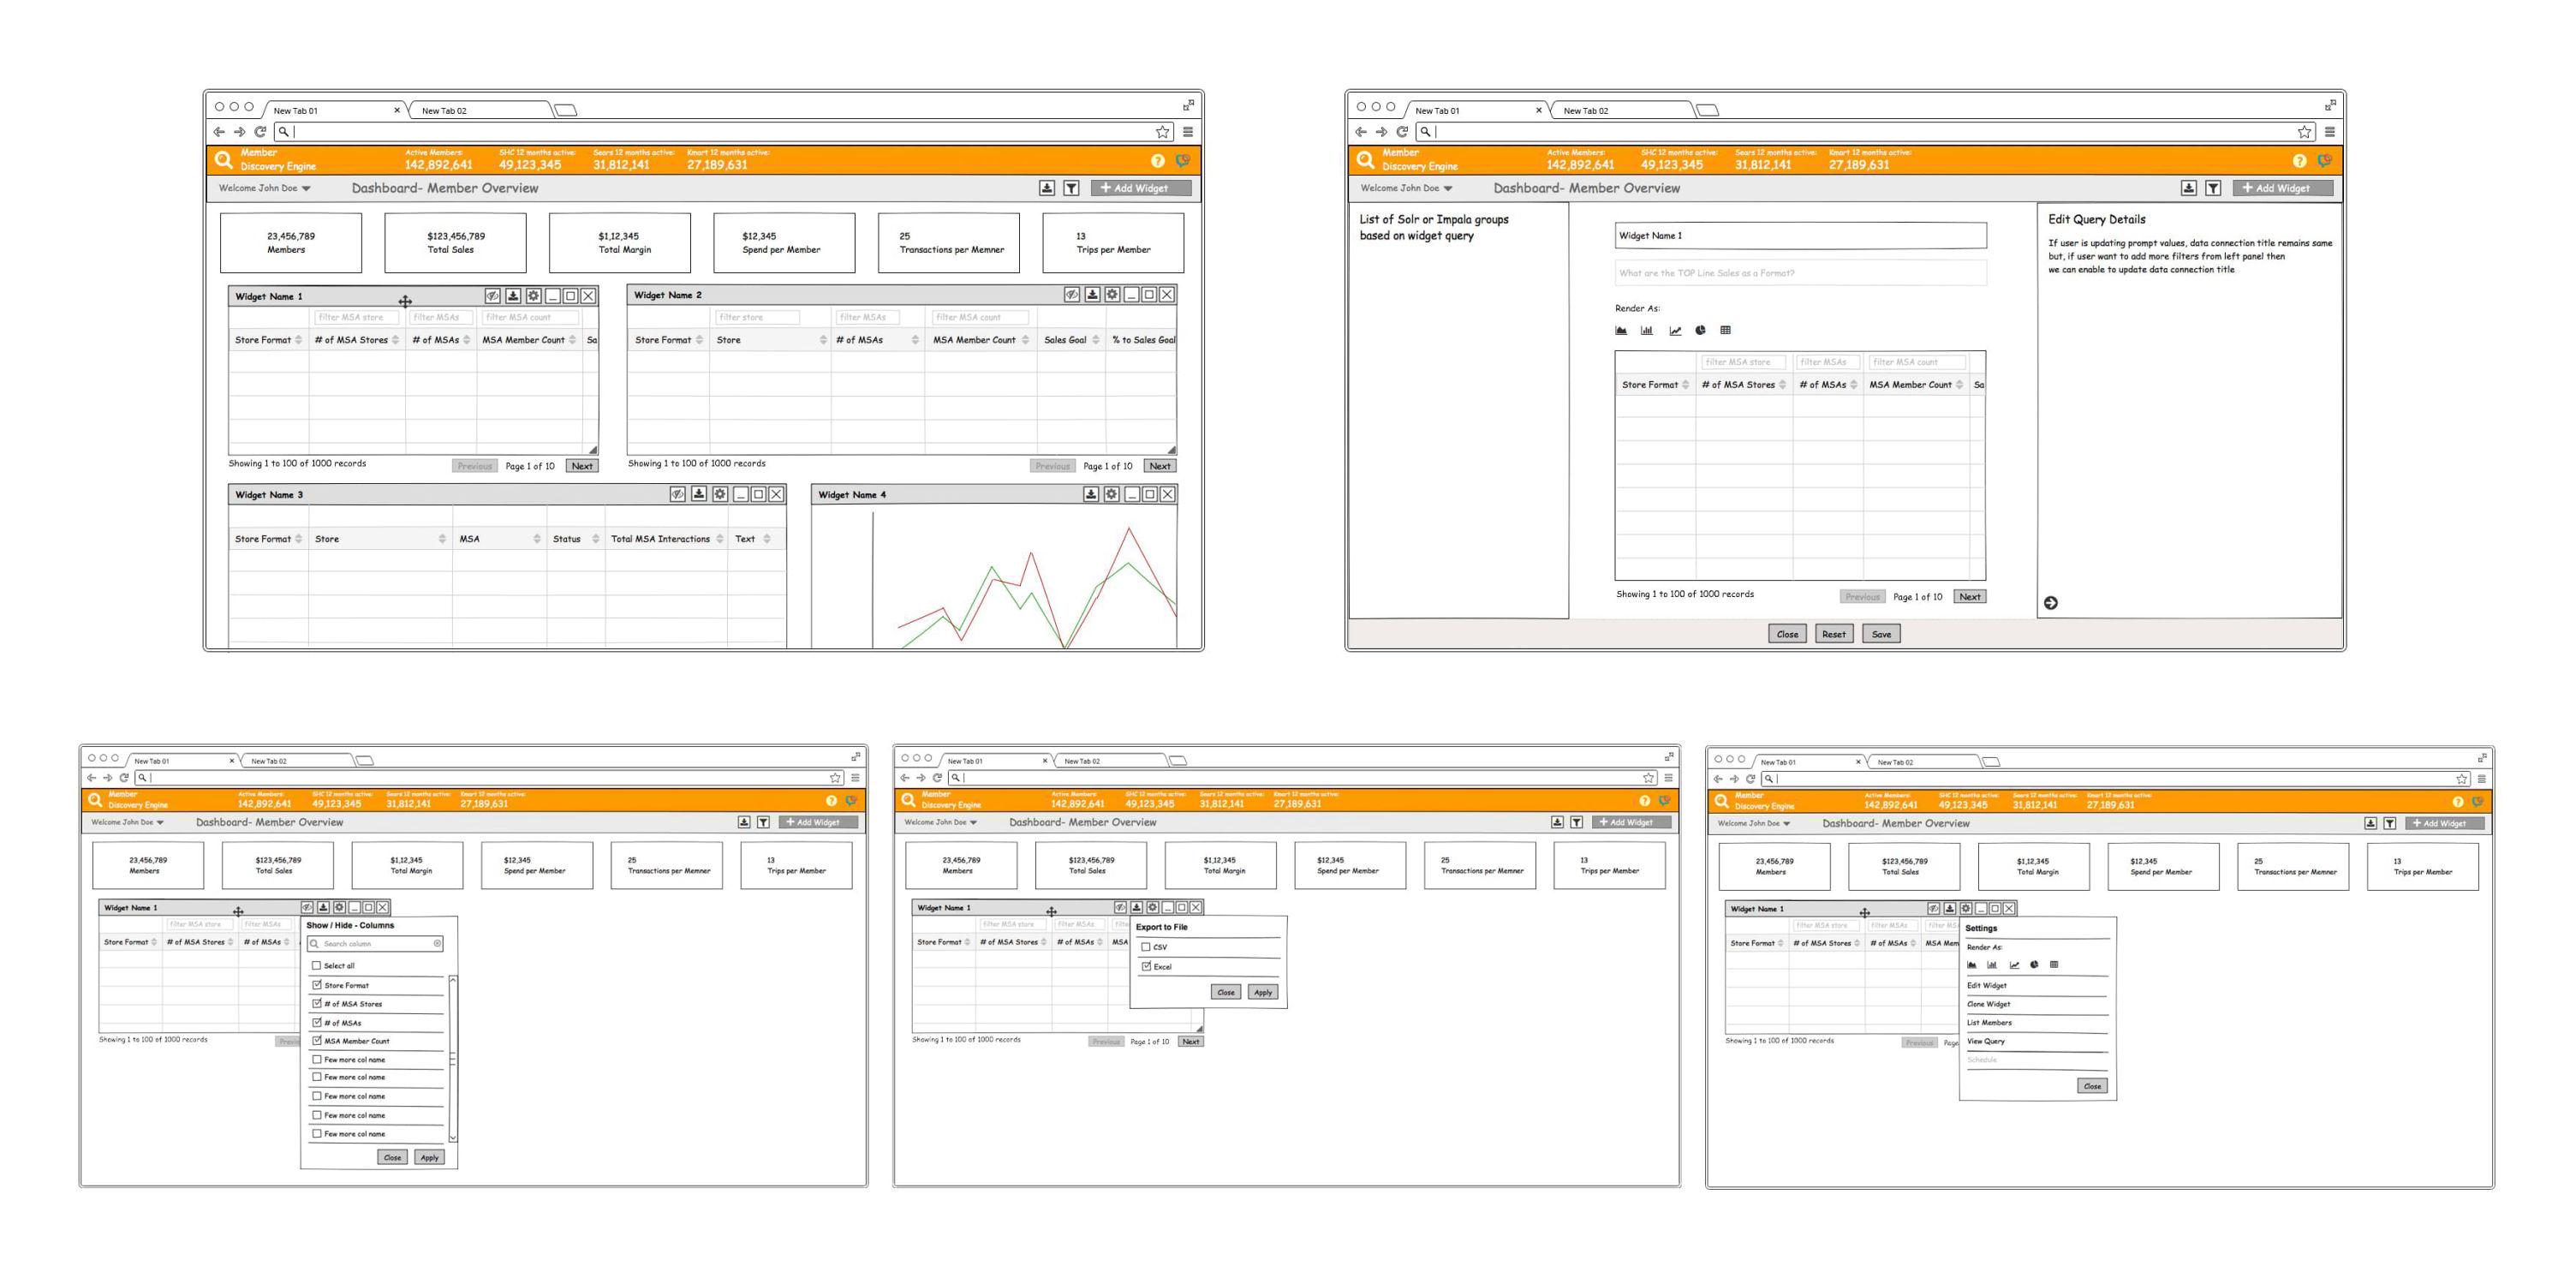
The first round of wireframes focused on page structure and information hierarchy. I laid out the search interface, results views, and report access patterns, then tested these with analysts and product managers to validate whether the layouts matched their mental models. This round surfaced critical gaps in filter logic and report categorization.
3. Lo-fi wireframes v2: refining flows
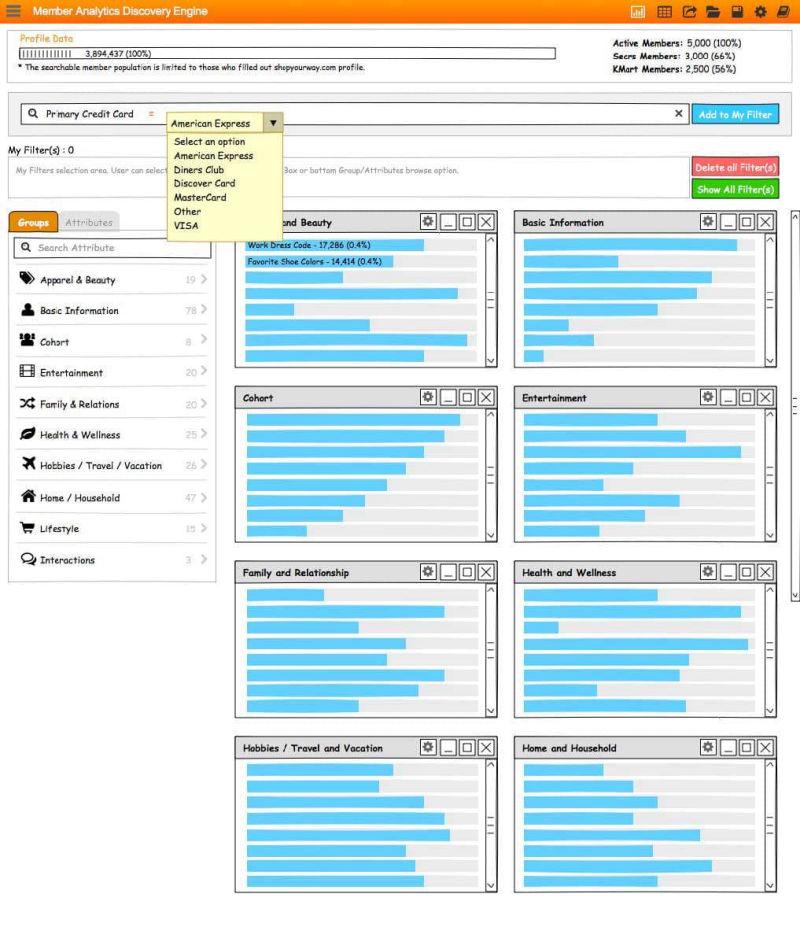
Based on stakeholder feedback, the second wireframe iteration tightened the query workflow, improved the report discovery experience, and introduced a dashboard concept that surfaced frequently accessed data upfront. This version established the interaction patterns that would carry through to the final product.
4. Hi-fi responsive prototype
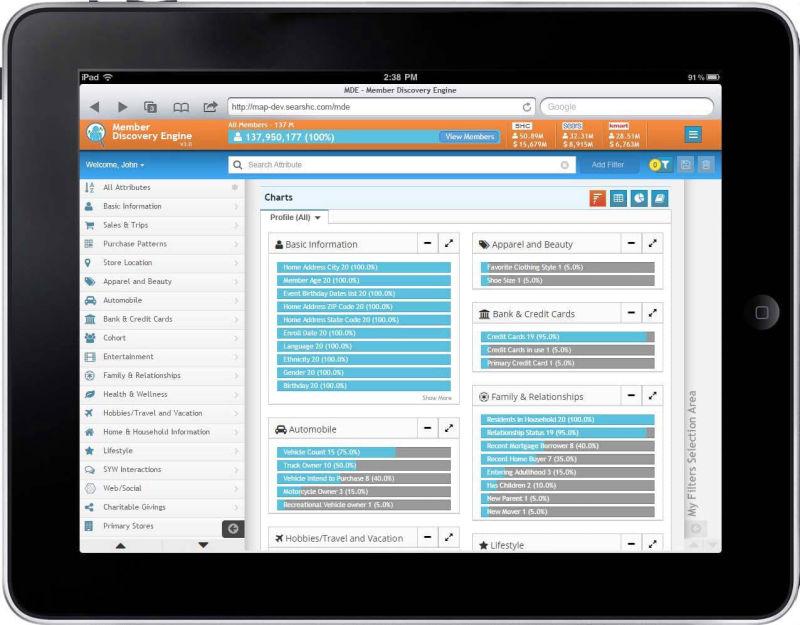
With the structure validated, I moved into high-fidelity design, building a responsive prototype that covered desktop, tablet, and mobile breakpoints. The prototype demonstrated real data patterns, interactive filtering, and drill-down behaviors, giving engineering a precise specification and giving stakeholders a tangible preview of the production experience.
5. Infographic & data visualizations
A significant part of MDE's value was making data legible at a glance. I designed infographics and data visualizations that translated raw member metrics into clear, scannable summaries, enabling quick decision-making without requiring users to interpret raw tables or exports.
6. Individual Member View (IMV)
As the MDE platform matured, it became clear that search results alone weren't enough. Analysts needed to transition seamlessly from a query result into a detailed member profile. The Individual Member View was designed as a focused child application: from any search result, users could open a full member profile showing purchase history, engagement timelines, segment membership, loyalty tier, and behavioral patterns. Designing IMV as a separate but connected experience kept the core MDE interface clean while giving power users the depth they needed.
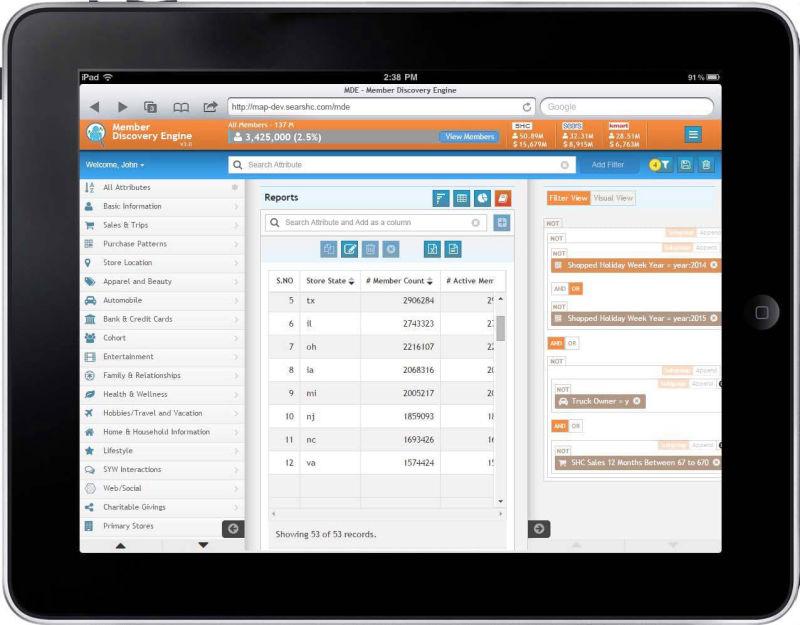
7. Self-service tool concept
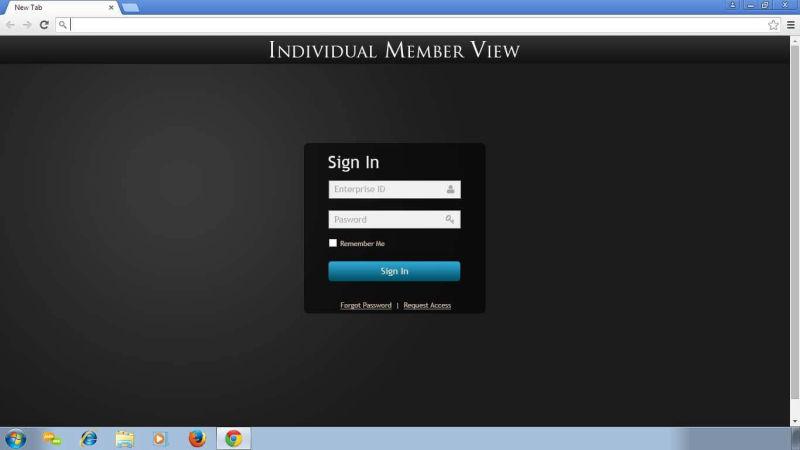
The final design direction emphasized self-service above all. Every decision, from the search-first landing experience to the contextual report suggestions, was driven by one principle: internal users should be able to answer their own questions without filing a request or waiting on another team. The MDE evolved to include a self-service analytics concept that would let non-technical users build and run their own queries through a guided interface, selecting data dimensions, applying filters, and generating reports without writing SQL or submitting requests to data engineering. This concept extended the platform's reach beyond analysts to marketing managers, merchandising leads, and other business users who needed data but lacked technical query skills.
Design Evolution
The design progressed through multiple fidelity stages, each validated with stakeholders before advancing. This iterative approach ensured alignment between business requirements, technical feasibility, and user needs.
Outcome & Impact
- Eliminated manual report bottlenecks: teams that previously waited days for data engineering to fulfill requests could now self-serve in minutes.
- Established a single source of truth: by centralizing member data access, MDE resolved the conflicting-numbers problem that had plagued cross-team decision-making.
- Scaled data literacy: the intuitive interface and built-in visualizations made member data accessible to non-technical stakeholders who previously couldn't engage with raw data.
- Enabled deep-dive analysis through IMV: the Individual Member View gave analysts a single, consolidated profile for any member, eliminating the need to cross-reference multiple systems for purchase history, engagement data, and segment membership.
- Informed the Member Analytics Platform: the design patterns and information architecture established in MDE became the foundation for the companion analytics application.
Selected Work
Lessons Learned
Design for the query, not just the answer
Most of the design work focused on how users framed their questions: the search experience, filter logic, and result prioritization. Getting the query right meant users trusted the answers.
Iterative fidelity builds alignment
Progressing deliberately from sketches through two wireframe rounds before going high-fidelity meant fewer costly revisions later. Each fidelity jump resolved a specific class of questions.
Data visualization is a design discipline
Presenting complex member data clearly required the same rigor as any interface design: hierarchy, contrast, progressive disclosure. The infographics were as carefully designed as the application screens.